📊 Executive Bank Loan Applications Dashboard in Excel
This project focuses on preparing, cleaning, and analyzing bank financial data, followed by building an interactive dashboard in Excel. Key business insights are also highlighted.
🛠️ Data Preparation in Excel
1. Importing Data:
The raw dataset was reviewed in Excel to understand its structure, identify irrelevant columns, and set appropriate data types—especially date formats.
2. Data Cleaning:
Steps included:
Removing duplicates: No duplicates were found.
Standardizing data:
Minor standardization like trimming spaces (=TRIM) or correcting capitalizations (=PROPER or =UPPER).
Filters were used to check consistency in names and terms.
Handling missing values:
Used XLOOKUP or manual filters to address missing data.
Filled missing Grades using the Sub_Grade column.
Estimated missing Interest Rates from similar rows.
Removing irrelevant Columns/Rows: Columns not relevant to the analysis were removed to simplify the dataset.
Adding new columns:
Created a Loan Quality Label based on the loan status:
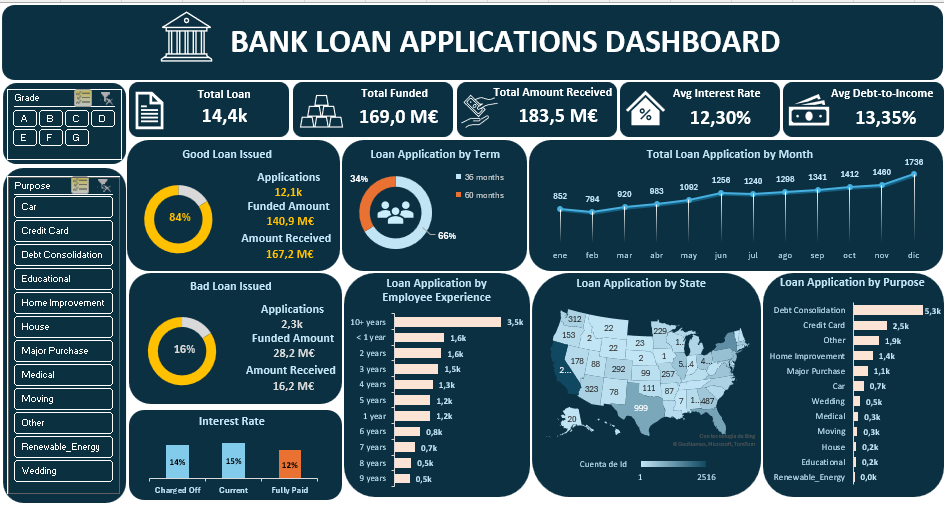
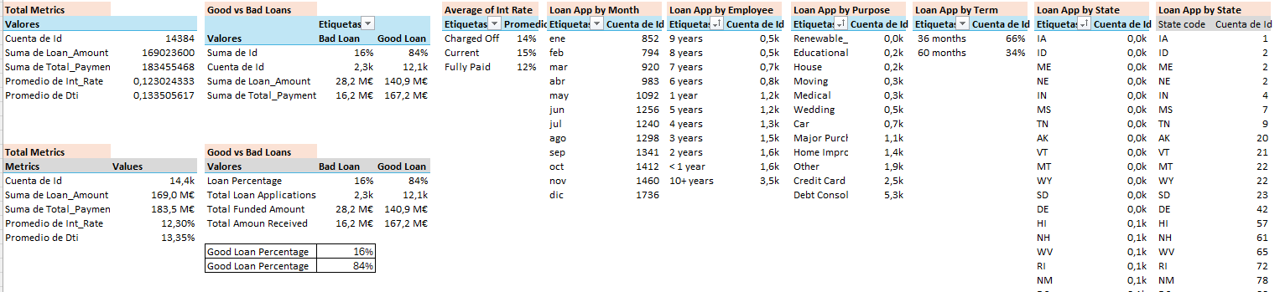
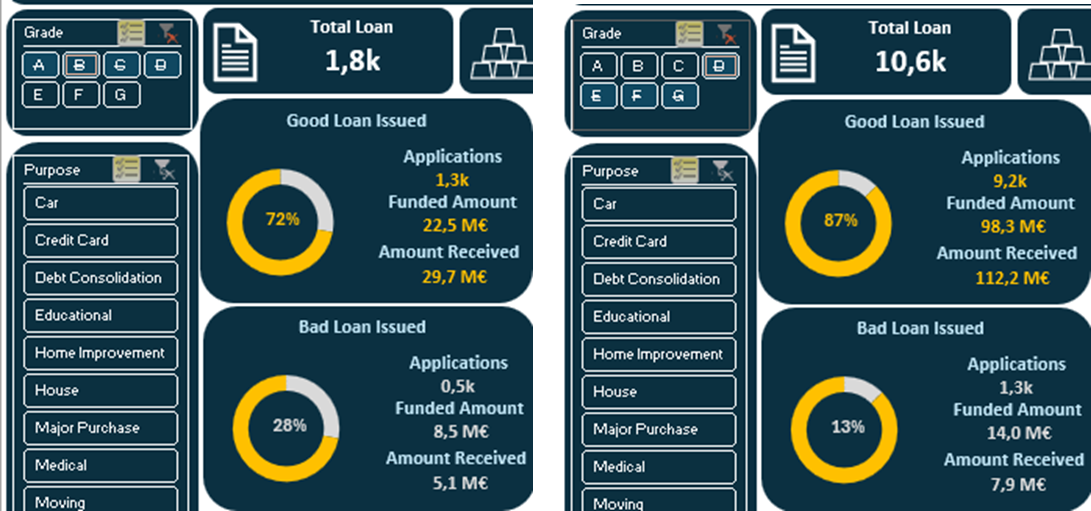
Before building the dashboard, key performance indicators (KPIs) were defined and summarized using PivotTables with proper formatting (%, currency, thousands/millions).
Key Metrics include: Total Loan Amount, Funded Amount, Amount Received, Average Interest Rate, Debt-to-Income Ratio (Good vs. Bad loans), Loan Counts by Employee, State, and Purpose, and Monthly Trends.