This project focuses on preparing and cleaning e-scooter market data using Excel, followed by the development of an executive-oriented dashboard in Tableau. The dashboard highlights key business insights and usage patterns.
The original dataset (available on Kaggle) was examined in Excel to understand its structure, identify unnecessary columns, and verify data types.
2. Data CleaningAll cleaning steps were performed using Excel. Key steps included:
The final cleaned dataset cannot be shared due to its large file size.
Cleaned data was imported into Tableau as .csv/.xlsx. Each column’s data type was validated, especially dates and times. Since Tableau requires a single field for time representation, a Calculated Field was created:
STR(DATEPART('hour',[Start Time]))
+ ':' +
RIGHT('00' + STR(DATEPART('minute',[Start Time])),2)
New Calculated Fields included: Weekday, Average Trips per Day, Average Trips per Weekday, and Percent of Total Rides.
Examples:
Weekday = DATENAME('weekday', [Start Date])
Average Trips per Day = COUNT([Trip ID]) / COUNTD(DATE([Start Date]))
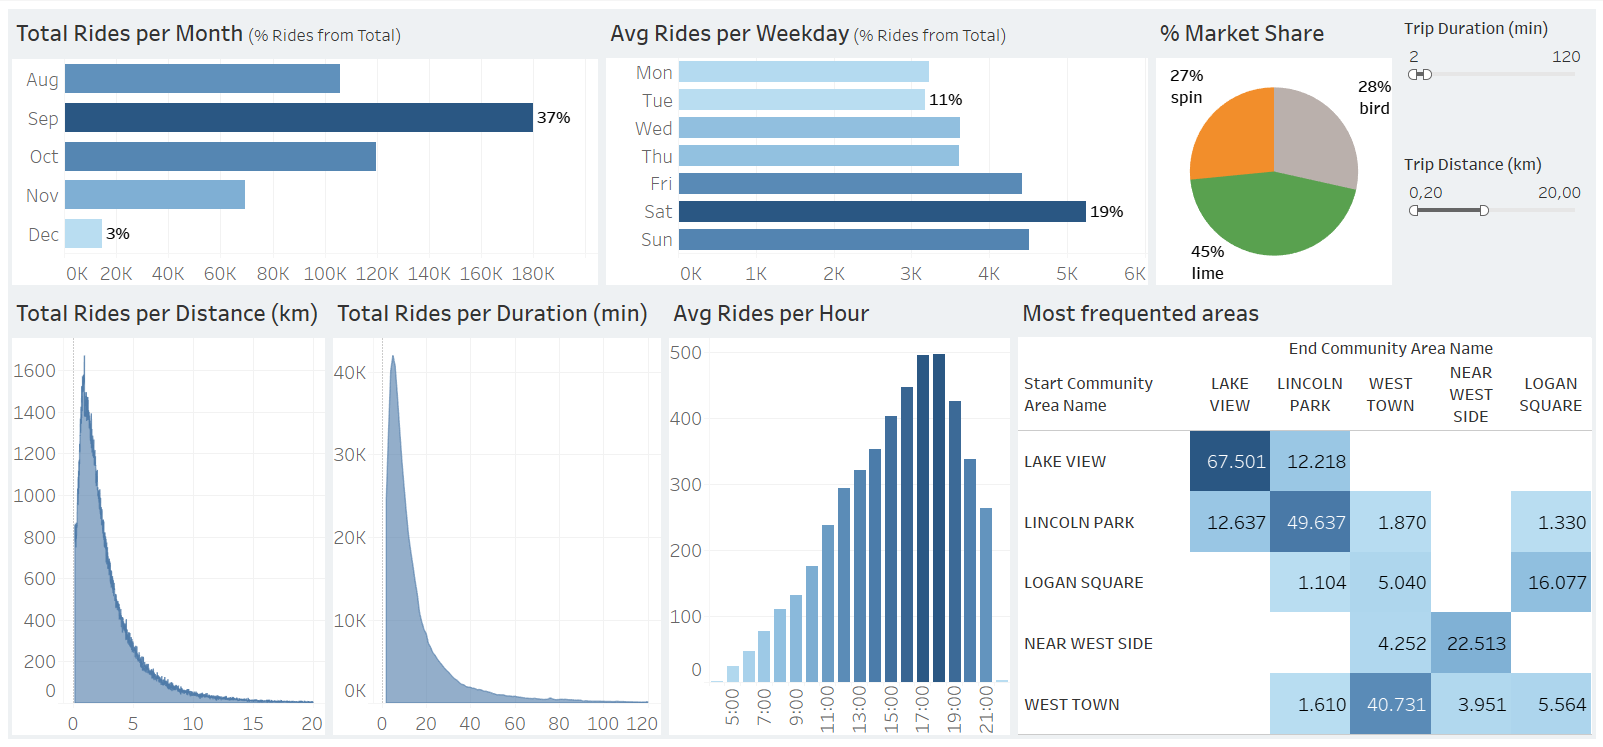
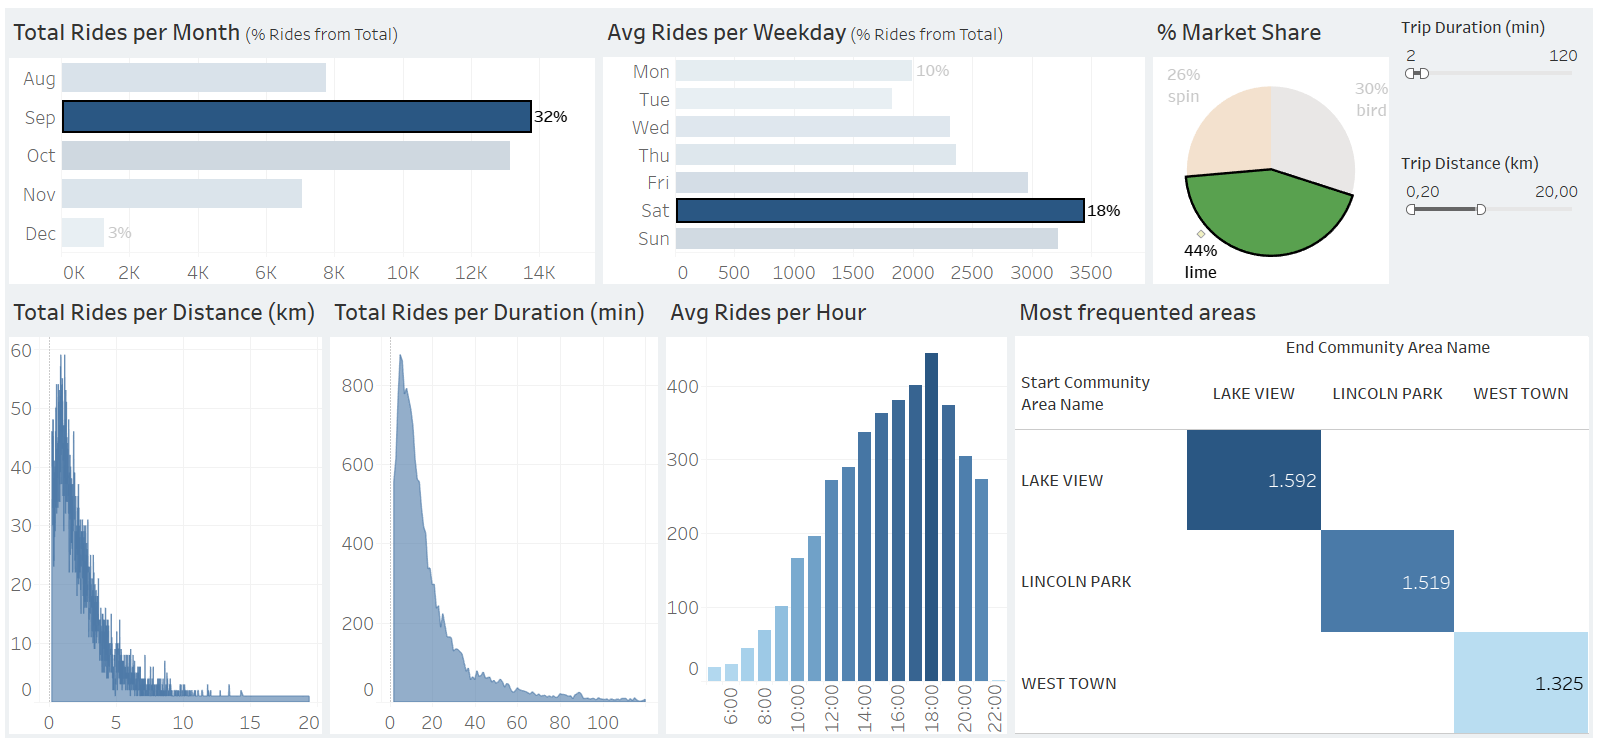
The dashboard design followed executive reporting principles:
Visualizations used:
Interactive filters enhance usability — allowing users to adjust by trip duration, distance, provider, weekday, or month.
Additional insights could be extracted if data on trip cost, revenue, profit, long-term trends (multi-year data), or user IDs were available. These would allow for profitability analysis, seasonal forecasting, and customer behavior tracking.